How to model founder dilution
Founder dilution is the mechanical reduction of founder ownership percentage at each financing event. Sources: priced-round investment dilution, option pool top-ups (typically pre-money), SAFE conversions (at the next round), and any secondary sales. A good dilution model lets a founder see their expected ownership at exit under various round-sequence assumptions, before signing the first term sheet. A bad dilution model gets surprised by the option pool top-up at Series A.
| When | Before each financing event; at strategic planning checkpoints |
|---|---|
| Output | Founder percentage at exit under defined round sequences |
| Inputs | Current cap table, planned rounds, pool refreshes, convertible instruments |
| Common surprise | Pre-money option pool top-up at Series A |
- Start with the current fully-diluted cap table, not just issued shares
- Model each planned round: round size, pre-money, post-money pool target
- SAFEs and convertible notes convert at defined events; their dilution must be modeled
- Option pool top-ups are typically pre-money: founders absorb the dilution
- Multiple scenarios (optimistic / base / pessimistic) bracket the realistic outcome
On this page
Steps
Build the current fully-diluted cap table
Start with the current share register: issued shares by holder and class. Add outstanding options (granted and unexercised). Add reserved-but-unissued option pool shares. Add outstanding SAFEs and convertible notes at their current conversion-event share counts (under defined assumptions). The sum is the current fully-diluted share count. Each holder's percentage is their share count divided by fully-diluted total.Define the planned round sequence
Identify the next 2-4 financing events: Series Seed (or remaining SAFEs), Series A, Series B, exit. For each, specify the round size, pre-money valuation, and post-money option pool target. The numbers are estimates; the point is to run the math under defined assumptions, not to predict the future precisely. A typical sequence: $2M seed SAFE (cap $10M), $8M Series A (pre $25M, pool top-up to 15%), $20M Series B (pre $80M), exit at $250M.Model the option pool top-up at each round
At each priced round, the pool is topped up to the target post-money percentage. The top-up is pre-money: it's added to the share count before the new investor's per-share price is computed. This is mechanically: new pool shares = (target % × post-money fully-diluted) - existing pool. The founder dilution from the pool top-up alone can be material (10-15% of founder ownership at Series A, depending on existing pool size).Model SAFE conversions
When the priced round happens, outstanding SAFEs convert. Each converts at its terms (cap, discount, MFN). The conversion adds new preferred-stock shares to the pre-money share count. The new investor's per-share price is computed after SAFE conversion. This means SAFE dilution comes out of the pre-money share count, not the new investor's stake. Multiple SAFEs at different caps create stacked dilution. See raise on SAFEs for the conversion mechanics.Compute per-share price and new investor shares
Once option pool top-up and SAFE conversion are reflected in the pre-money share count, compute: per-share price = pre-money valuation / pre-money fully-diluted share count. New investor shares = round size / per-share price. The new investor's percentage = new shares / post-money fully-diluted. Founder percentage = founder shares / post-money fully-diluted. Note that the founder share count itself doesn't change; the percentage falls because the denominator grows.Roll the model forward through each subsequent round
After each priced round, the cap table is updated. The next round's pre-money is computed off the new post-money. Option pool is topped up again if the target percentage is restored. Any new SAFEs raised between rounds convert at the next priced round. By the time the model reaches exit, the founder percentage reflects the cumulative dilution from all sources.Run sensitivity analysis
The single-line outcome is one scenario. Run optimistic (smaller rounds, higher valuations, smaller pool top-ups), base, and pessimistic (larger rounds, lower valuations, larger pool top-ups). The range across scenarios is realistic; the founder should be comfortable with the base and reasonably comfortable with the pessimistic. Pure optimism in the model is the source of post-round disappointment.
Common mistakes
- Modeling on issued shares instead of fully-diluted. Founder computes their percentage on issued shares only. The cap table looks favorable. The reality at exit is much lower because the option pool, SAFEs, and unexercised options all dilute fully-diluted percentages, which is what determines exit proceeds.
- Forgetting the option pool top-up at each round. Founder models Series A with the round size and valuation but forgets the option pool top-up. Actual dilution at Series A is 25-35% rather than the modeled 20%, all from the pre-money pool top-up. The realization happens at closing, too late to renegotiate.
- Treating SAFE conversion as post-money dilution. SAFEs convert in the pre-money share count. The new investor's price is set after SAFE conversion. Modeling the SAFE conversion as if it dilutes the new investor inflates the founder's modeled percentage.
- Using one valuation per round across all scenarios. The founder's model uses a fixed Series A valuation of $30M pre-money. Realistic scenarios should range from $15M (pessimistic) to $45M (optimistic). The founder percentage at exit varies significantly across this range; a single-point model hides the real risk.
- Ignoring liquidation preferences in exit modeling. Founder owns 30% at exit. Exit at $100M. Founder gets $30M, right? Not if the preferred has 1x liquidation preference and the round was $40M; the preferred takes $40M off the top, leaving $60M for the common at 1x participation. Founder's actual proceeds depend on whether liquidation preferences are participating or non-participating.
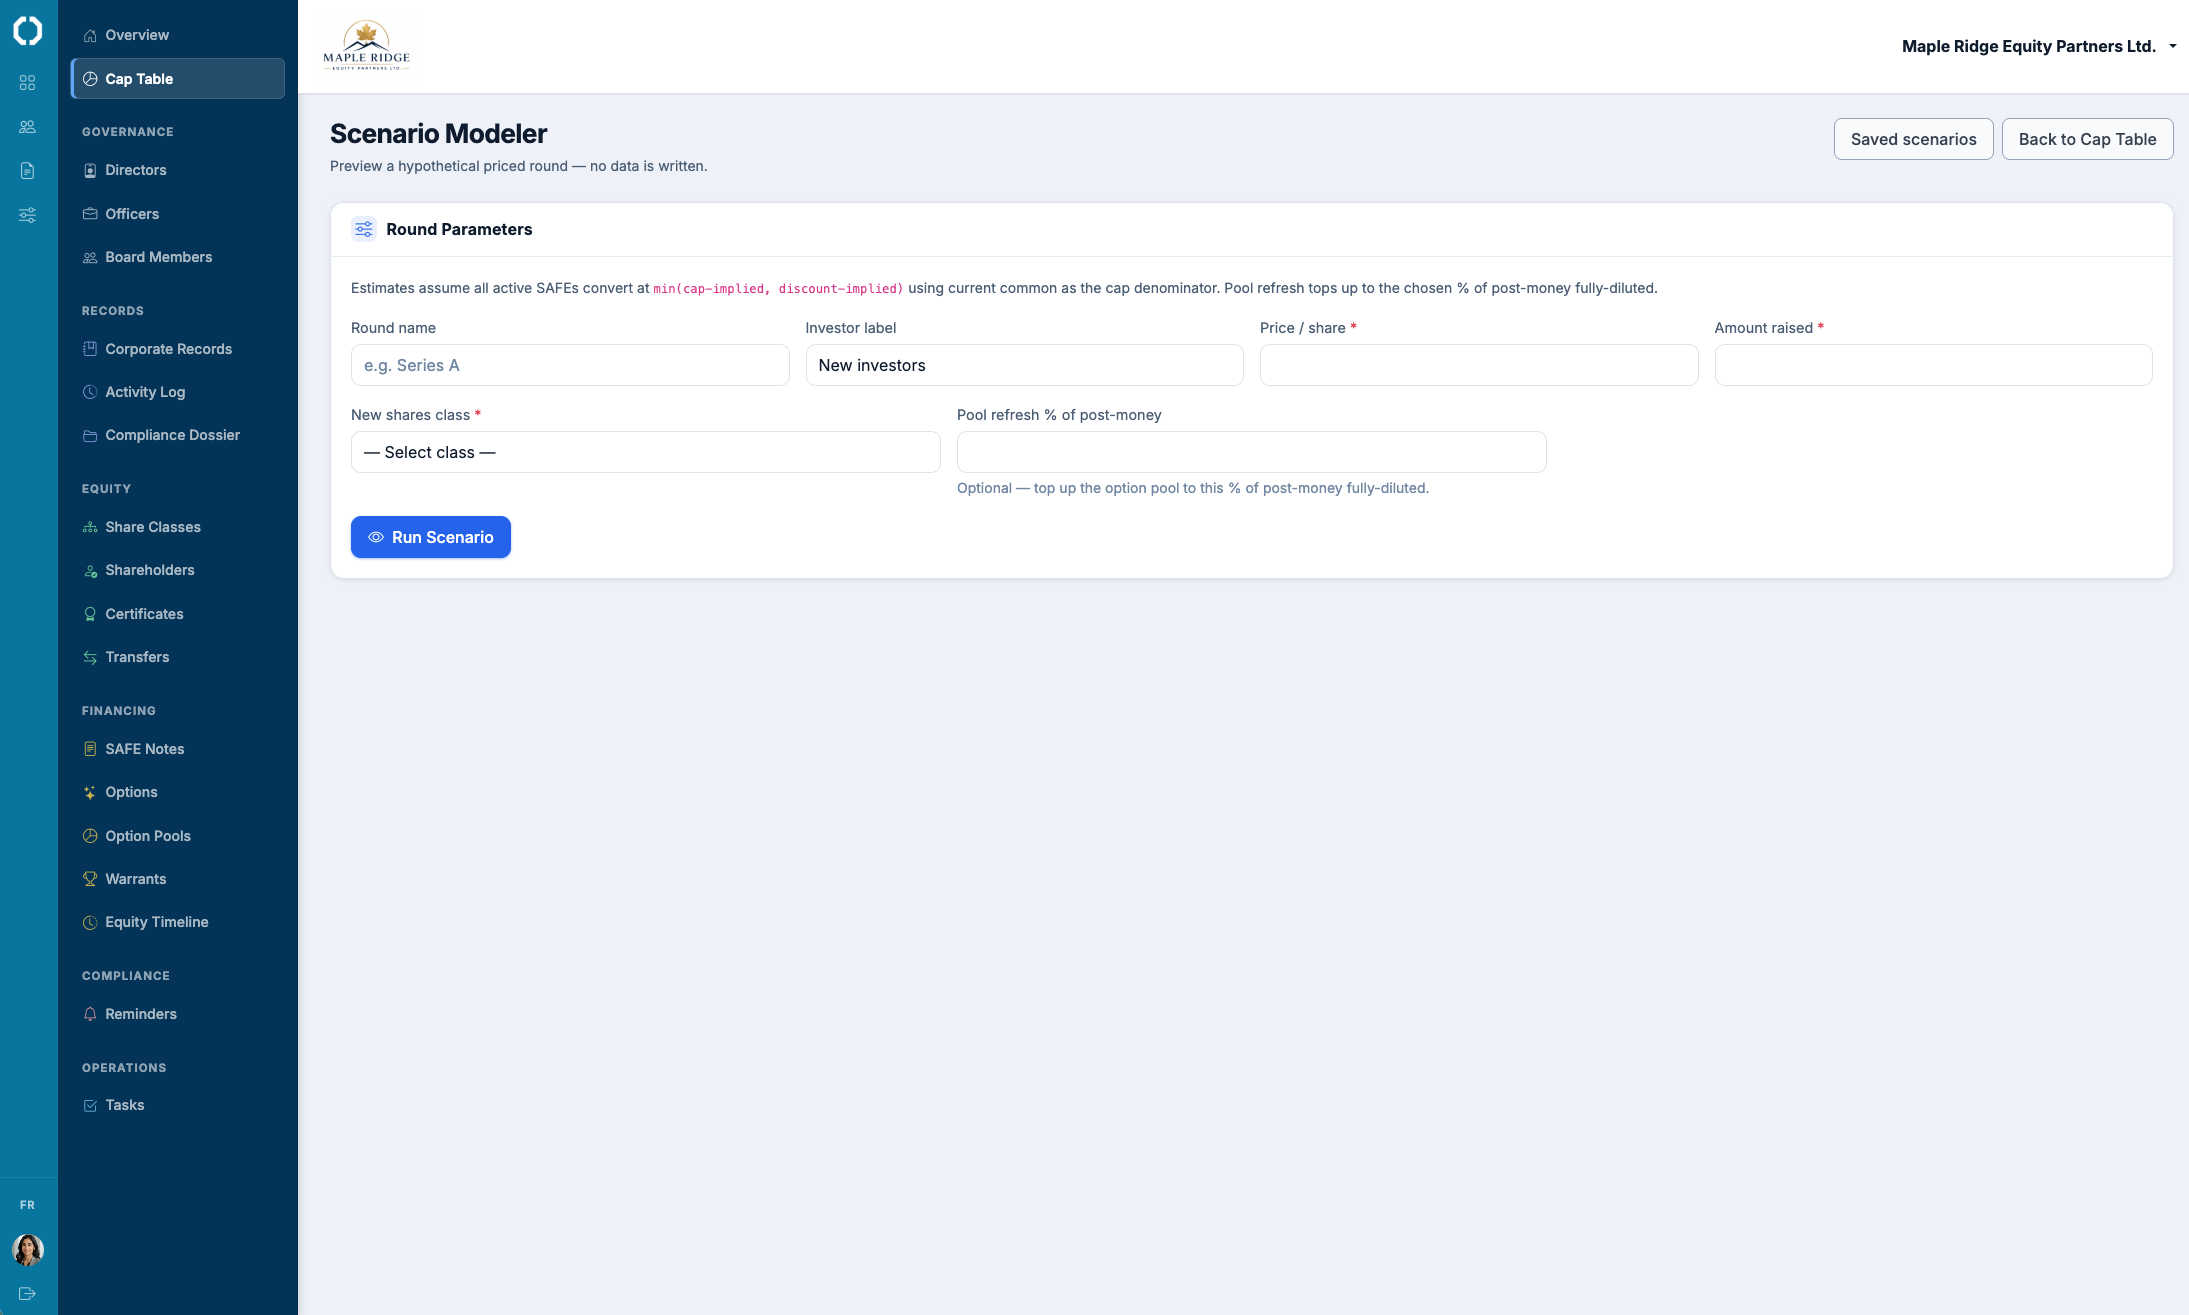
Octelligence's scenario modeling takes the live cap table, models multiple round sequences with pool top-ups and SAFE conversions, and produces founder ownership outcomes at exit under each. Compare scenarios side by side; commit to the round structure that fits.
See Cap Tables & FinancingCommon questions
Multi-round dilution modeling on the live cap table, with pool top-ups, SAFE conversions, and exit liquidation preferences all in the math.