Governance Maturity Benchmark 2026
The first benchmark study applying the Governance Maturity Framework to private corporations. Tier distribution, dimension-by-dimension findings, and the most common gaps, with cuts by stage, sector, and jurisdiction.
About this benchmark
This is the inaugural Governance Maturity Benchmark, applying the open Governance Maturity Framework to private corporations across stages, sectors, and jurisdictions. Subsequent annual editions will incorporate aggregated self-assessment data from corporations that run the free self-assessment tool, plus counsel-led assessments contributed by partner law firms.
This first edition is a baseline benchmark drawn from Octelligence's diligence-prep engagements, partner law-firm portfolio reviews, and aggregated patterns from existing assessment tools (Diligence Readiness Assessment, Corporate Records Health Check, Ownership Integrity Audit). The figures reported are directionally representative of the private-corporation governance landscape as observed in those engagements. They are not a statistical population sample. The 2027 edition will report aggregated data from corporations that have run the published self-assessment over the intervening 12 months, with explicit sample sizes and population descriptions.
The benchmark is intended to be used in three ways: as context for self-assessment results ("how does my Tier 2 score compare to peer corporations at my stage?"), as evidence for investment and acquisition diligence ("what is the typical governance posture at Series A?"), and as citable reference for analysts, journalists, and academic researchers writing about private-corporation governance.
Headline findings
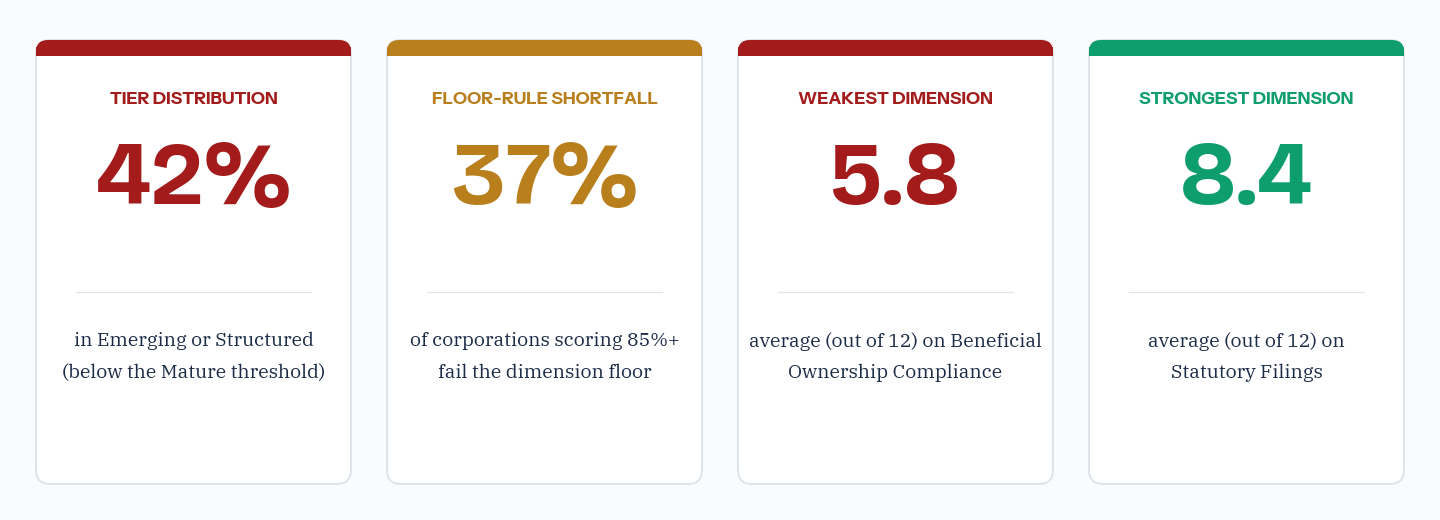
Tier distribution
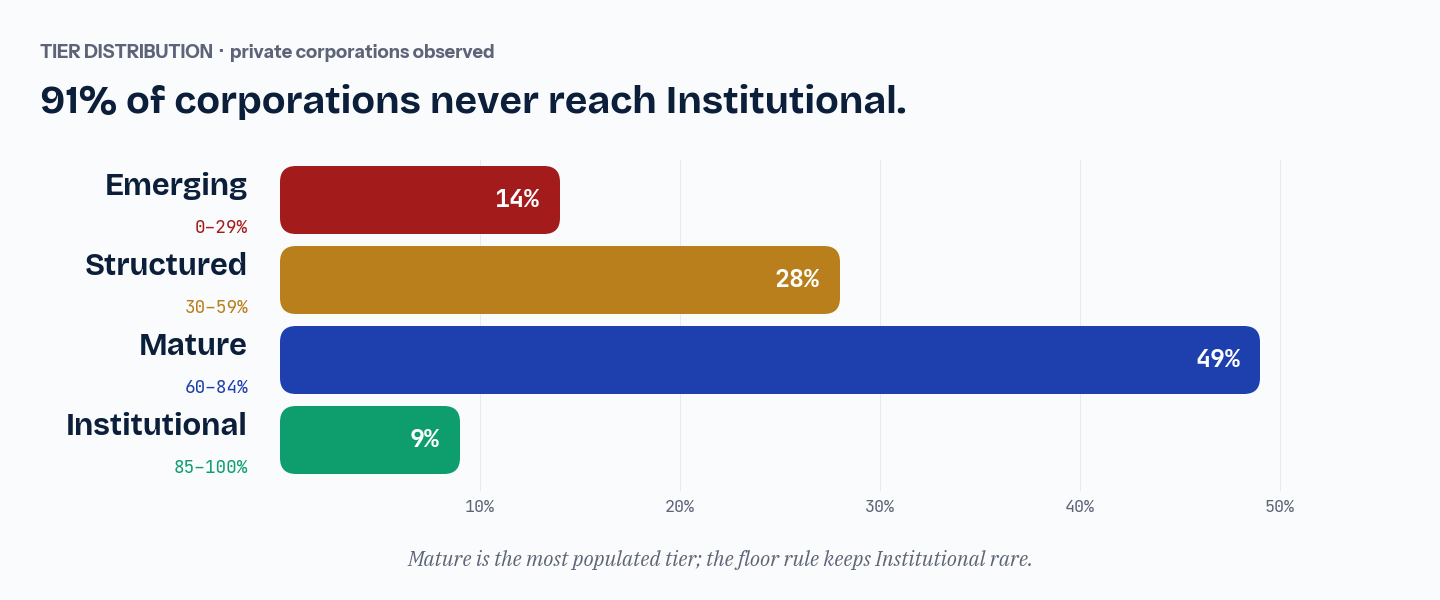
Across all corporations observed, the distribution skews toward the middle of the framework. A material minority sit in Emerging and a small minority reach Institutional. The Structured-to-Mature transition is the most heavily-populated stretch:
| Tier | Share | Visual |
|---|---|---|
| Emerging (0 to 29%) | 14% | |
| Structured (30 to 59%) | 28% | |
| Mature (60 to 84%) | 49% | |
| Institutional (85 to 100%, floor met) | 9% |
Among the 9 percent of corporations placing in Institutional, a further 37 percent of aggregate Institutional-range scorers (i.e. 85%+ aggregate) fail to place because at least one dimension is below 9 out of 12, demonstrating that the floor rule is doing meaningful work in distinguishing audit-grade governance from high-but-uneven posture.
Dimension-by-dimension findings
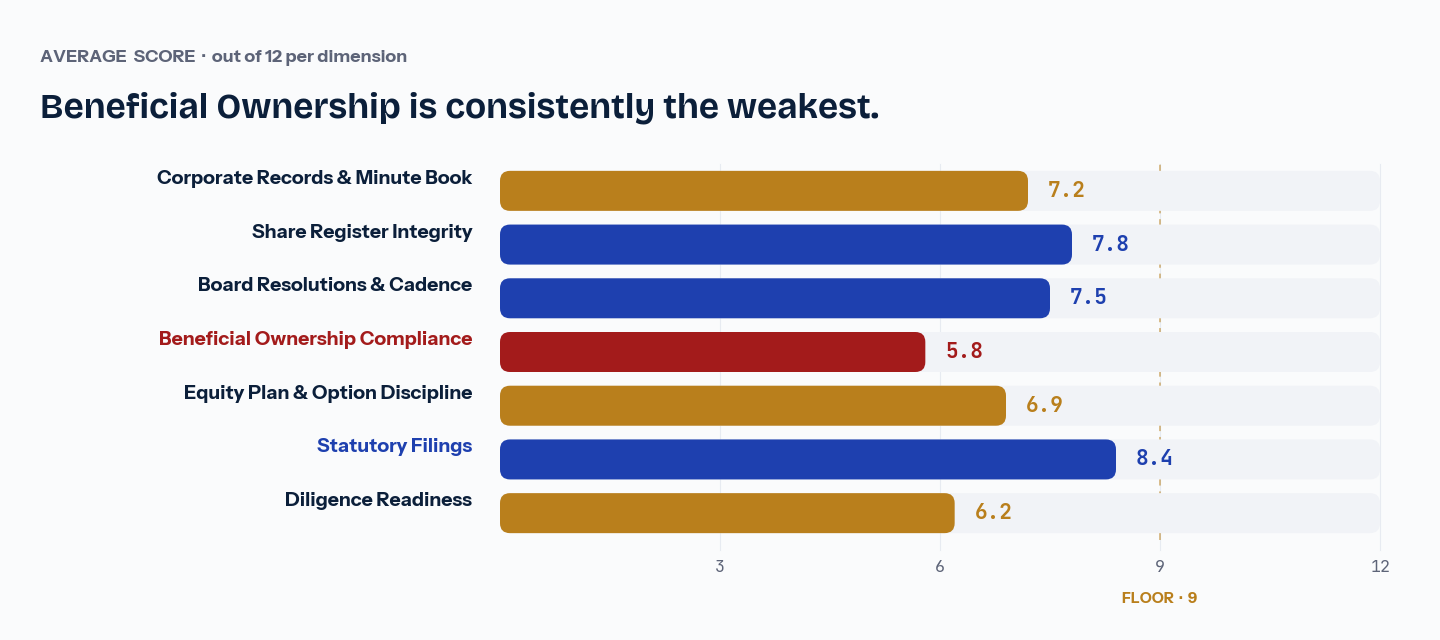
Average scores across the seven dimensions reveal where private-corporation governance is strongest and where it is consistently weak:
| Dimension | Average | Median | Most common gap |
|---|---|---|---|
| Corporate Records & Minute Book | 7.2 | 8 | Resolutions signed late or with missing signatures |
| Share Register Integrity | 7.8 | 8 | Register and cap table maintained as parallel sources |
| Board Resolutions & Cadence | 7.5 | 8 | Conflict-of-interest disclosures inconsistently recorded |
| Beneficial Ownership Compliance | 5.8 | 6 | Register exists but not updated on ownership changes |
| Equity Plan & Option Discipline | 6.9 | 7 | Stale or missing 409A at grant date |
| Statutory Filings | 8.4 | 9 | Director changes filed late or not at all |
| Diligence Readiness | 6.2 | 6 | No gap inventory; defects discovered in the transaction |
Beneficial Ownership Compliance is the most consistent weakness
Across stages, sectors, and jurisdictions, Beneficial Ownership Compliance scores the lowest of any dimension (average 5.8 out of 12). Three patterns dominate:
- The register exists at incorporation but is not updated as ownership changes through subsequent issuances, transfers, and option exercises
- The corporation files the initial regulatory submission (FinCEN BOI, Companies House PSC, Corporations Canada ISC) but misses the update window when ownership crosses a reporting threshold
- The internal beneficial-ownership register and the public regulator record drift apart over time, with neither matching the actual beneficial-ownership picture
The gap is largely a process gap, not a knowledge gap: most corporations know the obligation exists but lack an automatic trigger from share-register changes to register updates. Corporations that score 9+ on this dimension uniformly have system-level reconciliation between the share register and the beneficial-ownership register.
Statutory Filings are the most consistent strength
Statutory Filings is the highest-scoring dimension (average 8.4 out of 12), reflecting the well-established calendar discipline around annual returns and the visibility of the consequences of late filing (late fees, eventual administrative dissolution). The remaining weakness is director-change filings: corporations that file the annual return on time often miss the 14-to-15-day window for filing a director change.
By stage
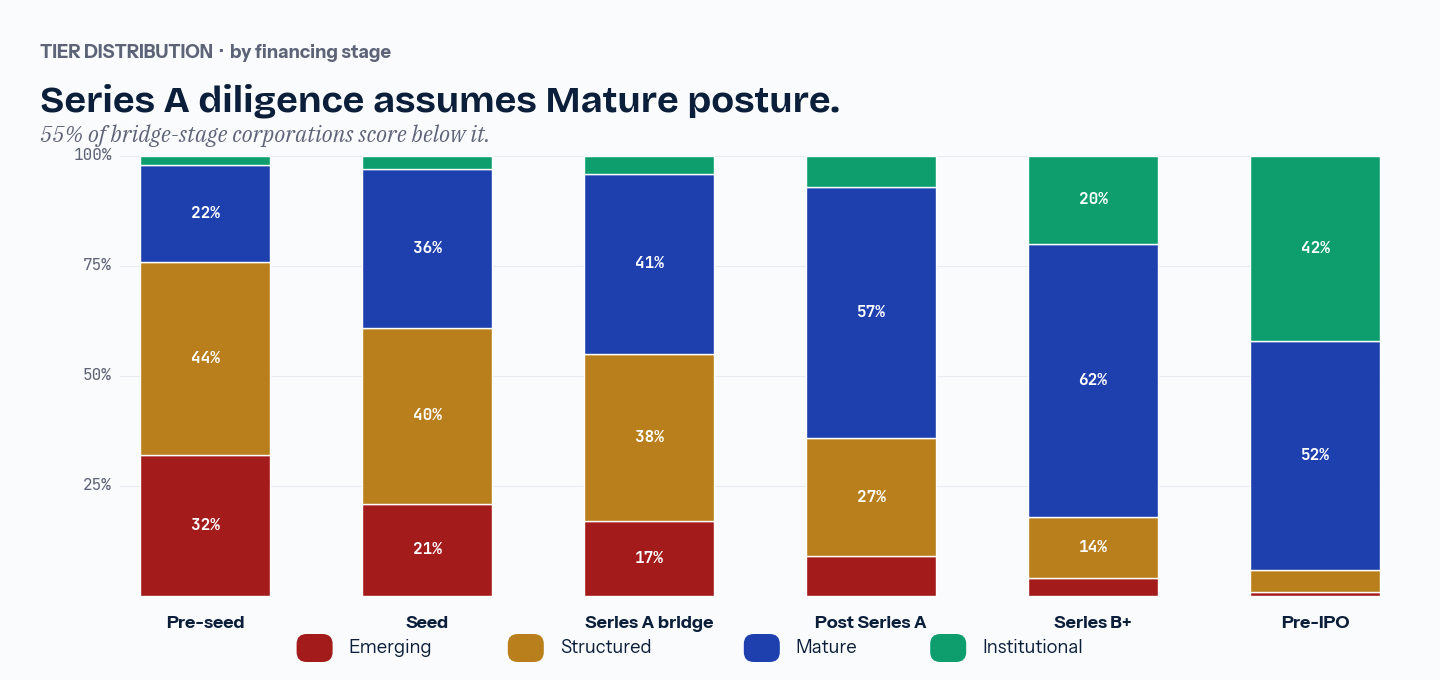
Tier distribution by financing stage shows the expected progression: earlier-stage corporations are weighted toward Emerging and Structured, and later-stage corporations toward Mature and Institutional. The exception is the Pre-Series-A bridge, where many corporations have outgrown their incorporation-era discipline but have not yet adopted institutional discipline:
| Stage | Emerging | Structured | Mature | Institutional |
|---|---|---|---|---|
| Pre-seed / incorporation | 32% | 44% | 22% | 2% |
| Seed | 21% | 40% | 36% | 3% |
| Series A bridge | 17% | 38% | 41% | 4% |
| Post Series A | 9% | 27% | 57% | 7% |
| Series B and beyond | 4% | 14% | 62% | 20% |
| Late-stage / pre-IPO | 1% | 5% | 52% | 42% |
Three observations:
- The Pre-Series-A bridge is the most under-prepared stage relative to typical investor expectations: 55 percent of bridge-stage corporations score below Mature, but the typical Series A diligence assumes Mature-level posture
- The Series A diligence "shock" (the gap between investor expectation and actual posture) is concentrated in three dimensions: Beneficial Ownership Compliance, Equity Plan & Option Discipline, and Diligence Readiness
- Institutional placement remains rare even at late-stage; only 42 percent of pre-IPO corporations achieve it, primarily limited by the floor rule rather than aggregate score
By jurisdiction of incorporation
Tier distribution varies less by jurisdiction than by stage, but jurisdiction-specific strengths and weaknesses do emerge. Delaware corporations are stronger on Equity Plan discipline (the 409A regime drives discipline by way of explicit penalty exposure); Canadian federal and provincial corporations are stronger on Statutory Filings (the registry filing rhythm is more demanding); UK corporations are stronger on Beneficial Ownership Compliance (the PSC register is integrated into the annual confirmation statement):
| Jurisdiction | Records | Register | Board | Beneficial | Equity | Filings | Diligence |
|---|---|---|---|---|---|---|---|
| Delaware (DGCL) | 7.4 | 7.9 | 7.7 | 5.4 | 7.6 | 8.1 | 6.5 |
| California | 7.0 | 7.6 | 7.3 | 5.7 | 7.2 | 8.0 | 6.0 |
| Canada (CBCA) | 7.5 | 8.0 | 7.6 | 6.4 | 6.5 | 8.8 | 6.3 |
| Ontario (OBCA) | 7.3 | 7.7 | 7.4 | 6.2 | 6.4 | 8.5 | 6.0 |
| United Kingdom | 7.1 | 7.8 | 7.5 | 7.0 | 6.7 | 8.6 | 6.4 |
The aggregate score range across the five jurisdictions is narrow (54.6 to 56.7 percent of maximum), but the dimension-level differences are interpretable: regulatory regimes drive behaviour on the dimension they police most heavily.
Implications for practitioners
For founders
Most founders overestimate their governance posture. The aggregate distribution shows that 42 percent of corporations sit below the Mature threshold. The high-leverage move depends on the current tier: Emerging corporations should focus on consistency (bring the records you already have into one place); Structured corporations should focus on reconciliation cadence (move from annual to monthly); Mature corporations should focus on the floor rule (find the weakest dimension and bring it to 9+).
For counsel
The Pre-Series-A bridge is the highest-impact intervention point. Corporations going into Series A diligence as Structured rather than Mature create remediation work that the financing timeline cannot accommodate. Counsel-led assessments six to nine months before the anticipated raise allow the corporation to advance to Mature before the diligence begins. Beneficial Ownership Compliance, Equity Plan, and Diligence Readiness are the dimensions where last-minute remediation is most likely to surface.
For investors and acquirers
Aggregate tier placement is a useful proxy for diligence risk, but the floor rule matters more than the aggregate. A Mature corporation with a single weak dimension (typically Beneficial Ownership Compliance or Equity Plan) is less risky than an Emerging corporation with broadly weak posture, but the single weak dimension is where remediation work or transaction-level structuring is most likely to be required. Investors using the framework as a diligence input should weight the lowest-scoring dimension as much as the aggregate.
For boards
The Institutional tier requires multi-stakeholder governance participation: an audit committee or equivalent, independent reconciliation, automated controls. Boards considering an IPO or institutional sale should target Institutional placement at least 24 months ahead of the anticipated event, with quarterly reviews of dimension-level scores during the run-up.
Methodology summary
The full methodology, including tier definitions, dimensions, criteria, and scoring rules, is published at the Governance Maturity Framework page. This benchmark applies the methodology unchanged. Key reproducibility notes:
- Framework version. All scoring uses Governance Maturity Framework v1.0.
- Data sources. Diligence-prep engagements, partner law-firm portfolio reviews, and aggregated patterns from existing free assessment tools. Not a statistical population sample.
- Stage classification. Based on most recent priced financing or, where no priced round has occurred, on the corporation's self-reported stage. Pre-IPO defined as having explicit IPO intent disclosed by the board within the next 24 months.
- Jurisdiction classification. Based on the jurisdiction of incorporation, not the jurisdiction of operations. Corporations with multiple incorporated entities are counted under the holding entity's jurisdiction.
- Score derivation. Scored on the 0-3-per-criterion scale described in the framework. Aggregated to dimension scores (sum of 4 criteria, max 12) and overall score (percent of 84 maximum).
The 2027 edition will incorporate aggregated self-assessment data from corporations that have run the published self-assessment tool over the intervening 12 months. The sample size, population description, and any methodology refinements will be disclosed in that edition.
Related research and resources
- Governance Maturity Framework v1.0: the open methodology this benchmark applies
- Corporate Records Maturity Framework: deeper five-stage model for the Corporate Records dimension
- The Diligence Failure Taxonomy: the patterns of records failure most often surfaced in financing and M&A diligence
- Cross-Jurisdiction Governance Comparison: side-by-side governance requirements across CBCA, DGCL, OBCA, and Companies Act 2006
- Governance Maturity Self-Assessment: free interactive tool that runs the framework against your records
- Diligence Readiness Assessment: narrower diligence-specific scoring
The free 28-question self-assessment runs the framework against your records and places you in a tier with personalized advancement guidance.